




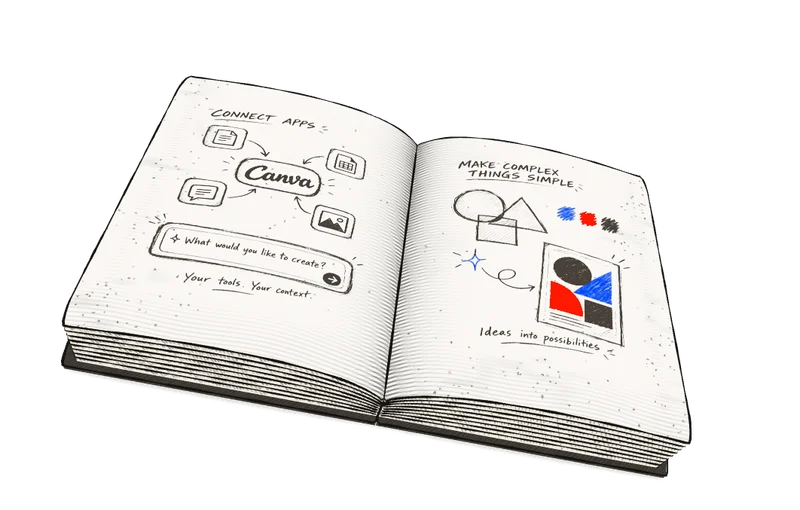
Canva Data Connectors · 2024–2025
Bring your datainto Canva.
Import into Sheets. Refresh Charts. Personalise designs with Bulk Create.
Refresh a Statista source and see the chart update, with confirmation that the data is synced.
Canva Charts · Refresh connected data without rebuilding the design.
 HubSpot
 Google Sheets
 Google Analytics
 Asana
 Statista
- Design leadership & direction
- Juan Córdoba
- Design & product
- Vojislav · Product design
Offy · Product manager - Collaboration
- Ecosystem, Sheets, Data Visualisation & Bulk Create
Engineering, vendors & partners
01 / The opportunity
People’s data already had a home. Their designs needed a way in.
A sales report, a campaign chart, a batch of personalised designs: each starts with information held somewhere else. We wanted people to choose that information inside Canva, use it, and return to refresh it when the source changed.
The bigger challenge was making this work across products. I worked with the Sheets and Data Visualisation teams to turn separate import needs into a common experience that partners could build on.
Sheets: bring HubSpot data into the work.
A customer list becomes a starting point inside Canva Sheets. People can choose the list in HubSpot, preview its data and import it without moving between tools.
Bring CRM data into a Canva Sheet through a connected app, ready to work with inside Canva.
02 / The key decision
Let partners know their data. Let Canva own the familiar parts.
I made the first patterns tangible with Vojislav, showing how a partner’s query interface on the left could sit beside a Canva-owned table preview. A HubSpot list and a Google Analytics report need different choices, but people should not have to learn a different import flow for each.
That boundary shaped the API contract. Partners could build source-specific selection and fetching; Canva could handle the shared preview, import and refresh experience. We explored both editor panels and an app modal, keeping the capability independent of where it appeared.
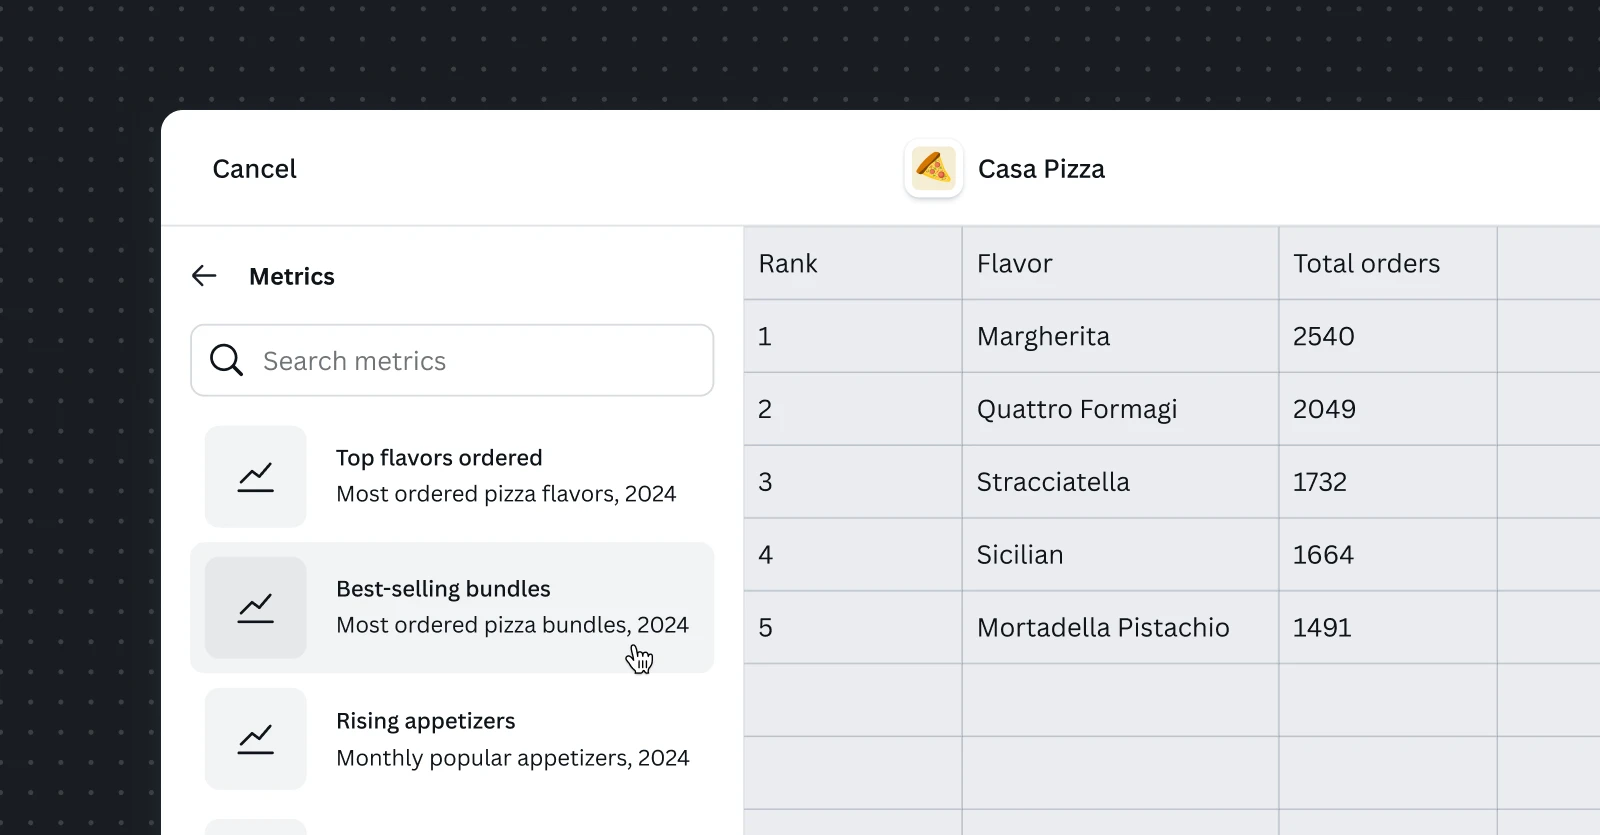
Charts: refresh the data, keep the design.
We separated choosing data from fetching it, so people could update a connected chart without rebuilding it. The Monthly Tracker demo above shows that decision in action: refresh the Statista source, and the chart updates within the existing design.
03 / Leading delivery
Make the platform real, one partner and one workflow at a time.
I worked hands-on with Vojislav to refine the interactions, coached app design, and briefed vendors on the experience we needed. Apps such as HubSpot, Google Analytics and World Bank gave us concrete use cases to work through, rather than designing the platform in the abstract.
Across Canva, I established alignment sessions, shared principles and a roadmap for data imports. Working with the Bulk Create team connected those decisions to a different task: using rows of data to make personalised designs at scale.
Bulk Create: turn CRM data into personalised designs.
The same HubSpot connection could power a different outcome: connect customer names to a template and generate a personalised design for each person.
Populate a template with customer data to create a batch of personalised designs.
04 / Impact & learning
One connector. More ways to create with data.
Data Connectors launched with Canva Sheets at Canva Create 2025, with the shared capability supporting Sheets, Charts and Bulk Create. People could bring source data into their work and refresh it; partners gained a way to reach multiple workflows through one integration.
For us, this was also the first practical test of the Intents model. Its lessons shaped the platform that followed. My reflection was that shared patterns needed shared understanding earlier: clearer examples and education beyond the core teams would help the next intent move further, faster.
See Canva’s launch announcementExplore the three customer workflows and the published API model.